R package {datasets}에 있는 데이터 CO2 를 사용하여 분석과 시각화를 해보겠습니다. 먼저 아래와 같이 물음표를 앞에 붙여 CO2를 콘솔에 입력하면 오른쪽에 데이터의 설명에 대해서 볼 수 있습니다. 데이터 구성이 어떻게 되어 있는지 View(CO2)를 통해 확인합니다.
?CO2
View(CO2)
CO2 데이터는 식물이 얼마나 이산화탄소를 흡수하느냐를 측정한 데이터라는 것을 알 수 있습니다. 총 84 row와 5개의 column으로 exploratory analysis를 시행해보면 Plant 에는 Type (Quebec, Mississippi), 그리고 Treatmentd (nonchilled, chilled) 에 따라 각 12개의 distinct value가 있음을 알 수 있습니다.
Plant 이름에 Q가 들어가면 Quebec, M은 Mississippi를 나타내고, n은 nonchilled, c는 chilled를 나타냅니다.


각 variables에 따른 설명과 Details는 다음과 같습니다. 퀘벡의 6개 식물과 미시시피의 6개 식물의 CO2 흡수를 다양한 CO2 주변 환경으로부터 측정하였다고 나와 있습니다. 실험을 수행하기 전에 각 유형의 식물 절반을 하룻밤 chilled(차갑게 하다)했음을 알 수 있습니다.
| variables | explanation |
| Plant | an ordered factor with levels Qn1 < Qn2 < Qn3 < ... < Mc1 giving a unique identifier for each plant. |
| Type | a factor with levels Quebec Mississippi giving the origin of the plant |
| Treatment | a factor with levels nonchilled chilled |
| Conc | a numeric vector of ambient carbon dioxide concentrations (mL/L). |
| uptake | a numeric vector of carbon dioxide uptake rates (μmol/m2 sec). |
Details
The CO2 uptake of six plants from Quebec and six plants from Mississippi was measured at several levels of ambient CO2 concentration. Half the plants of each type were chilled overnight before the experiment was conducted.
This dataset was originally part of package nlme, and that has methods (including for [, as.data.frame, plot and print) for its grouped-data classes.
그럼 우리는 각 식물의 CO2흡수량이 얼마나 많은지, 어떤 식물이 가장 효과적으로 CO2를 흡수하는지 시각화해보도록 하겠습니다.
일단 데이터를 aggregate해야겠죠. 12 종류의 Plant를 기준으로 평균 CO2흡수량을 구해서 ggplot에 사용할 data frame을 만들어줍니다 (코드 아래에).
아래의 플랏을 보면 일반적인 geom_bar()를 사용하였을 때, 그리고 그것을 coord_flip()을 사용하여 옆으로 돌렸을 때, 그리고 마지막으로 우리의 final view 인 coord_polar() 를 볼 수 있습니다.

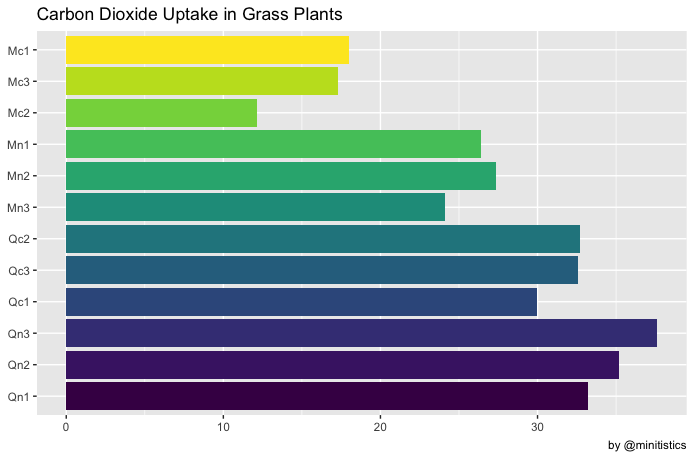
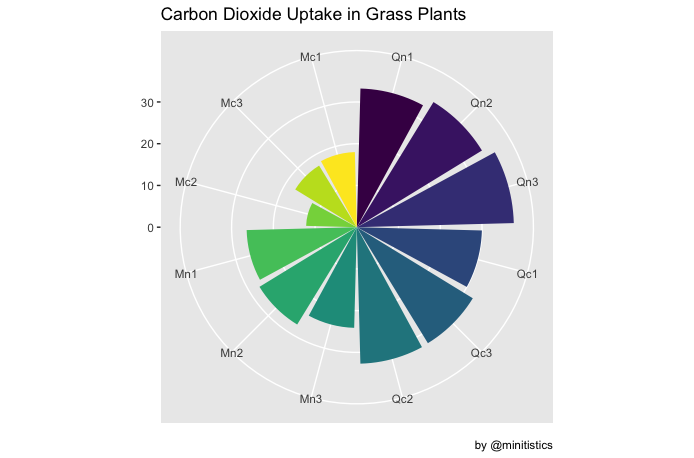
- 대체적으로 퀘벡의 식물들의 이산화탄소 흡수량이 미시시피의 식물보다 월등히 많다는 것을 시각적으로 확인할 수 있습니다.
- nonchilled 의 경우에, 특히 미시시피의 식물들은 이산화탄소 흡수량이 눈에 띄게 증가한 것이 보입니다.(식물학에 대해서는 잘 모르지만, 식물을 차갑게 했을 때와 아닐 때의 이산화탄소 흡수량을 보는 것이 의미가 있어서 데이터를 수집했으리라 짐작합니다.)
- 지구온난화와 밀접한 연관이 있는 식물의 이산화탄소 흡수량에 대해, R package에 있는 작은 데이터지만, 저 역시 배울 수 있어 좋았습니다.
## @minitistics
library(tidyverse)
library(ggplot2)

## bring data in and tidy up
df <- CO2 %>%
      select(Plant, uptake) %>%
      group_by(Plant) %>%
      mutate(co2_uptake =  mean(uptake)) %>%
      distinct(Plant, co2_uptake)

## create ggplot
bar <- ggplot(df, aes(x = Plant, y = co2_uptake, fill = Plant)) +
  geom_bar(stat = "identity", show.legend = FALSE) +
  labs(title = "Carbon Dioxide Uptake in Grass Plants",
       x = NULL, y = NULL,
       caption = "by @minitistics")

## bar
bar

## bar flip
bar + coord_flip()

## bar polar
bar + coord_polar()'호주 데이터 분석가 > DataViz' 카테고리의 다른 글
| [R] 한국 인구밀도 R에서 3D로 그리기 (0) | 2024.08.27 |
|---|---|
| [R] Korea Forest in 3D (2) | 2024.08.27 |
| [R] 호주 인구분포 - Are there any people? (0) | 2024.08.26 |
| [R] map_data와 ggplot 이용하여 지도 그리기 (0) | 2023.07.04 |
| ggplot2 scatterplot 기초 (0) | 2023.05.26 |


댓글